Stock market crashThe Feedback Loops of Panic Selling
A stock market crash is a sudden, dramatic drop in share prices across a major part of the market, causing a massive loss of paper wealth. It happens when economic trouble combines with crowd panic in a loop: people rush to sell their shares, which drives prices down and forces even more people to sell. While crashes are uncommon and usually hit when investors are overly optimistic, they can wipe out years of financial gains in a few days.
By the edgi team We find the most surprising true thing about an idea and build a 60-second lesson around it.
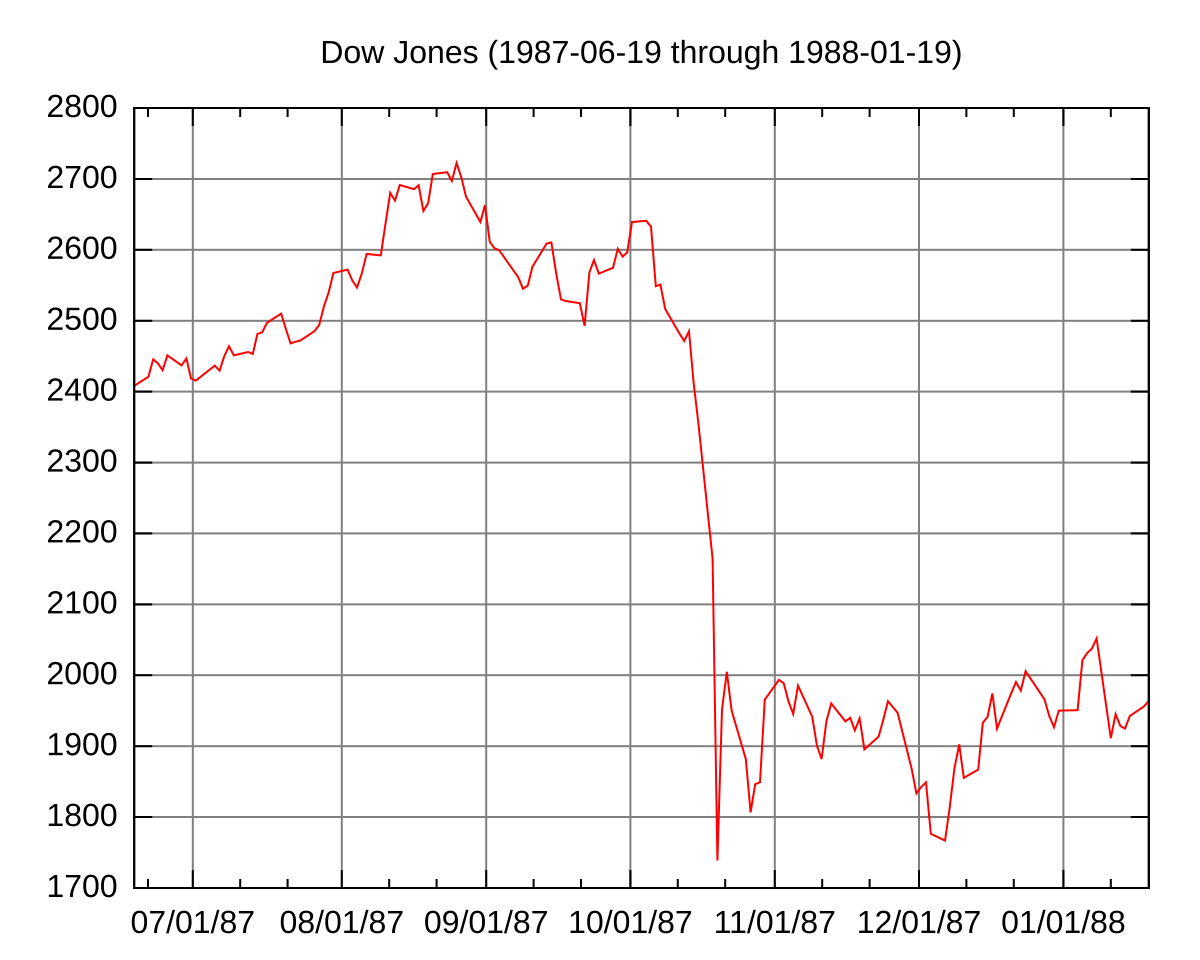
On October 19, 1987, the Dow Jones Industrial Average lost 22.6% of its value in a single day. It remains the largest one-day percentage drop in its history. No war, no bank failure, no major disaster had hit that weekend. Analysts still argue about the cause.
Markets in Hong Kong, London and New York all plunged within hours, so the panic was global before most people finished breakfast.
The feedback loop
A crash is a sudden, severe drop in prices across a big slice of a market. A smaller pullback of around 10% is called a market correction. A crash is faster and deeper, and it is driven by fear. The engine is a loop. Prices fall, some investors sell to limit losses, and that selling pushes prices down further, which frightens more investors into selling.
In 1987, some funds used computer-driven strategies that automatically sold as prices dropped. That fed the loop at machine speed.
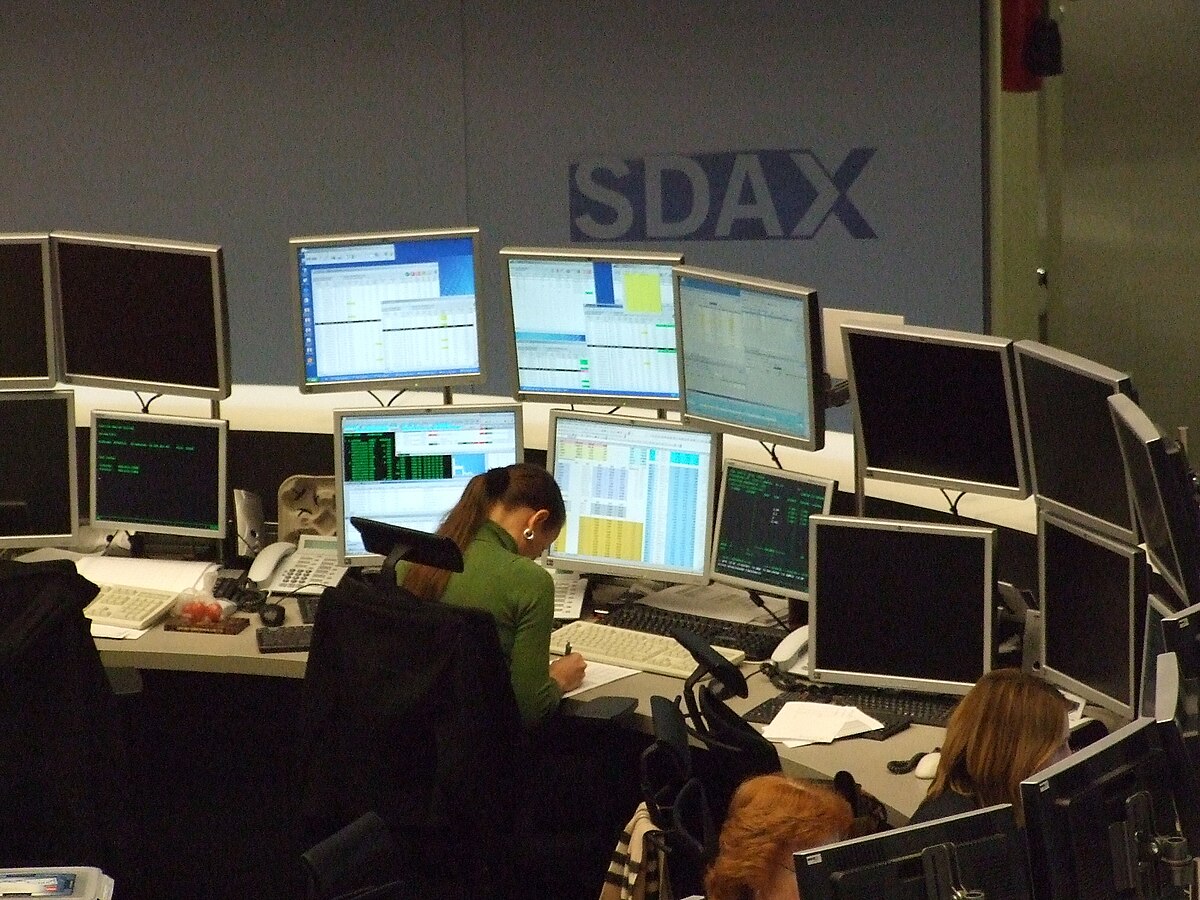
An employee at the Deutsche Börse working at a desk surrounded by multiple computer monitors displaying various financial data and charts. Dontworry, CC BY-SA 3.0, via Wikimedia Commons
What sets the stage
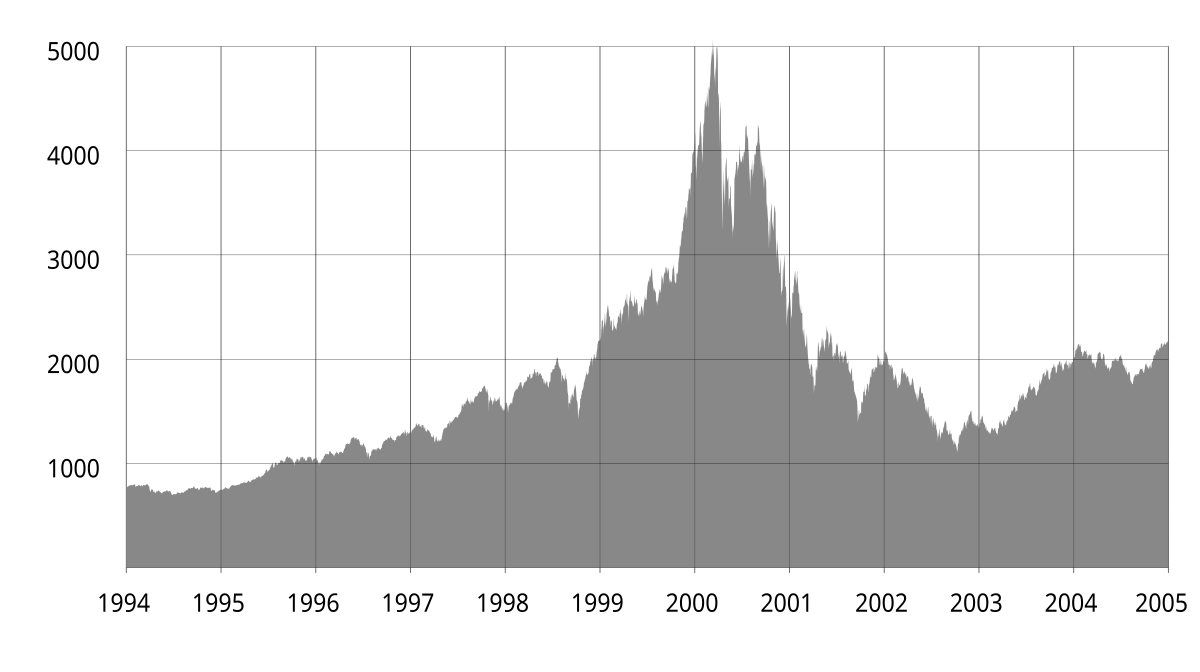
Crashes usually follow an economic bubble: a stretch when prices climb far beyond what the underlying businesses justify, because people expect them to keep climbing. Once the belief breaks, there are few buyers left, so even a modest shock can topple prices that were propped up by hope.
Area graph showing the Nasdaq Composite index from 1994 to 2005, illustrating the dot-com bubble. Lalala666 at English Wikipedia, Public domain, via Wikimedia Commons
Losses in a crash are largely paper wealth. A share only turns into a real loss when someone sells it, which is exactly what panic pushes people to do.
When it spreads
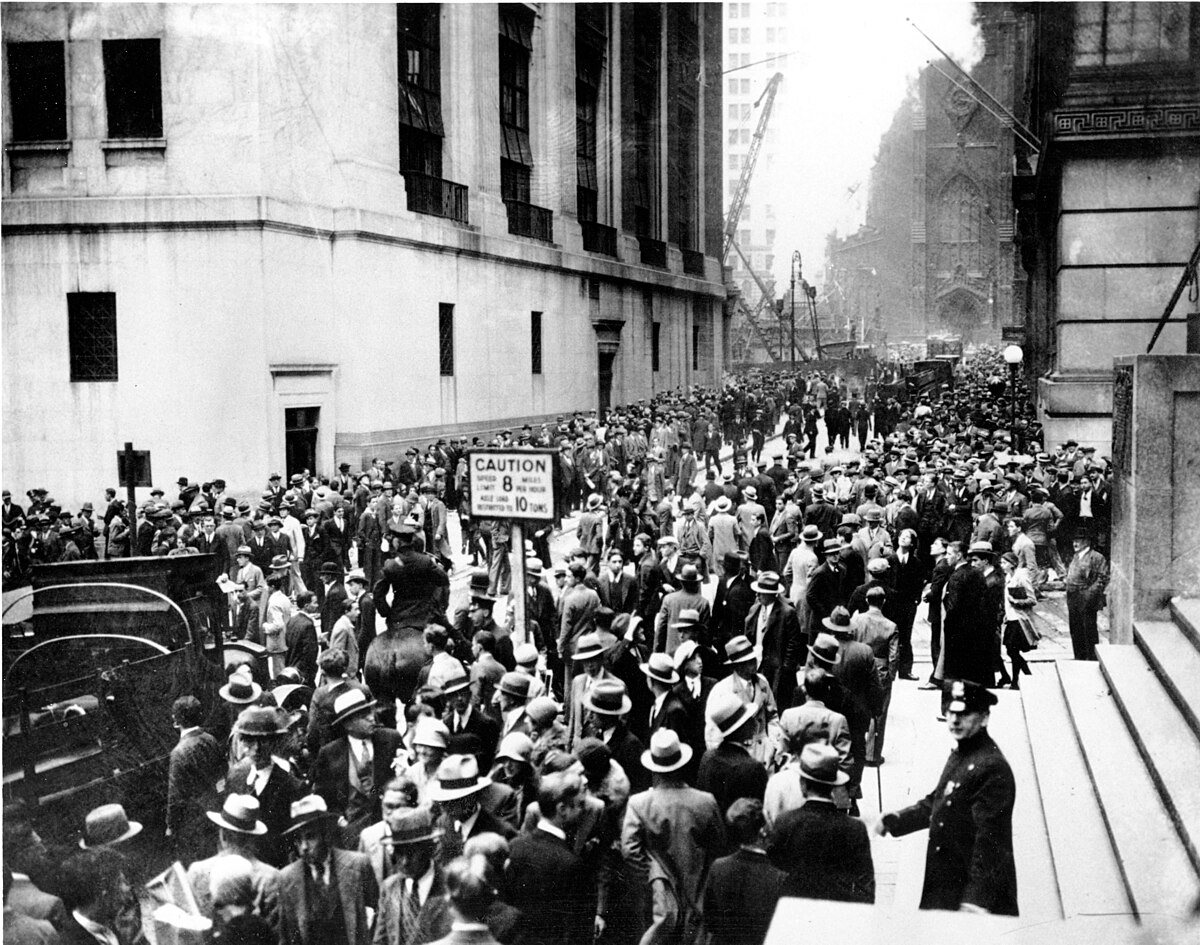
The Wall Street crash of 1929 shows the worst case. Stock losses hit banks and households, credit dried up, and the damage helped deepen into the Great Depression. 1987 went the other way: the Federal Reserve promised to supply cash to the financial system, and the economy avoided a slump.
A black and white photograph of a large crowd gathering on Wall Street in New York City after the 1929 stock market crash. Associated Press, Public domain, via Wikimedia Commons
So a crash is a stock-price event first. Whether it becomes a broader economic disaster depends on how much real lending and spending was tied to those prices.
How market crashes happen
Crashes are social phenomena where external economic events trigger crowd psychology. A prolonged bull market, where prices rise steadily and economic optimism runs high, often sets the stage. In these environments, price-to-earnings ratios exceed long-term historical averages, and investors take on heavy margin debt by borrowing money from brokers to buy more shares.
When prices begin to dip, a positive feedback loop takes over. Falling prices trigger margin calls, forcing overextended investors to sell their shares immediately to pay back their brokers. This deluge of sell orders drives prices lower still, igniting wider panic. Other external shocks, such as wars, corporate hacks, natural disasters, or shifts in federal regulations, can also spark these widespread sell-offs.
The Wall Street Crash of 1929
Between August 1921 and September 1929, the Dow Jones Industrial Average rose more than sixfold, climbing from 63.9 to 381.2. The economic boom of the 1920s saw huge advances in radio, aviation, automobiles, and electrical grids. Investors borrowed heavily to purchase shares in pioneering companies and new investment trusts, betting that prices would climb indefinitely.
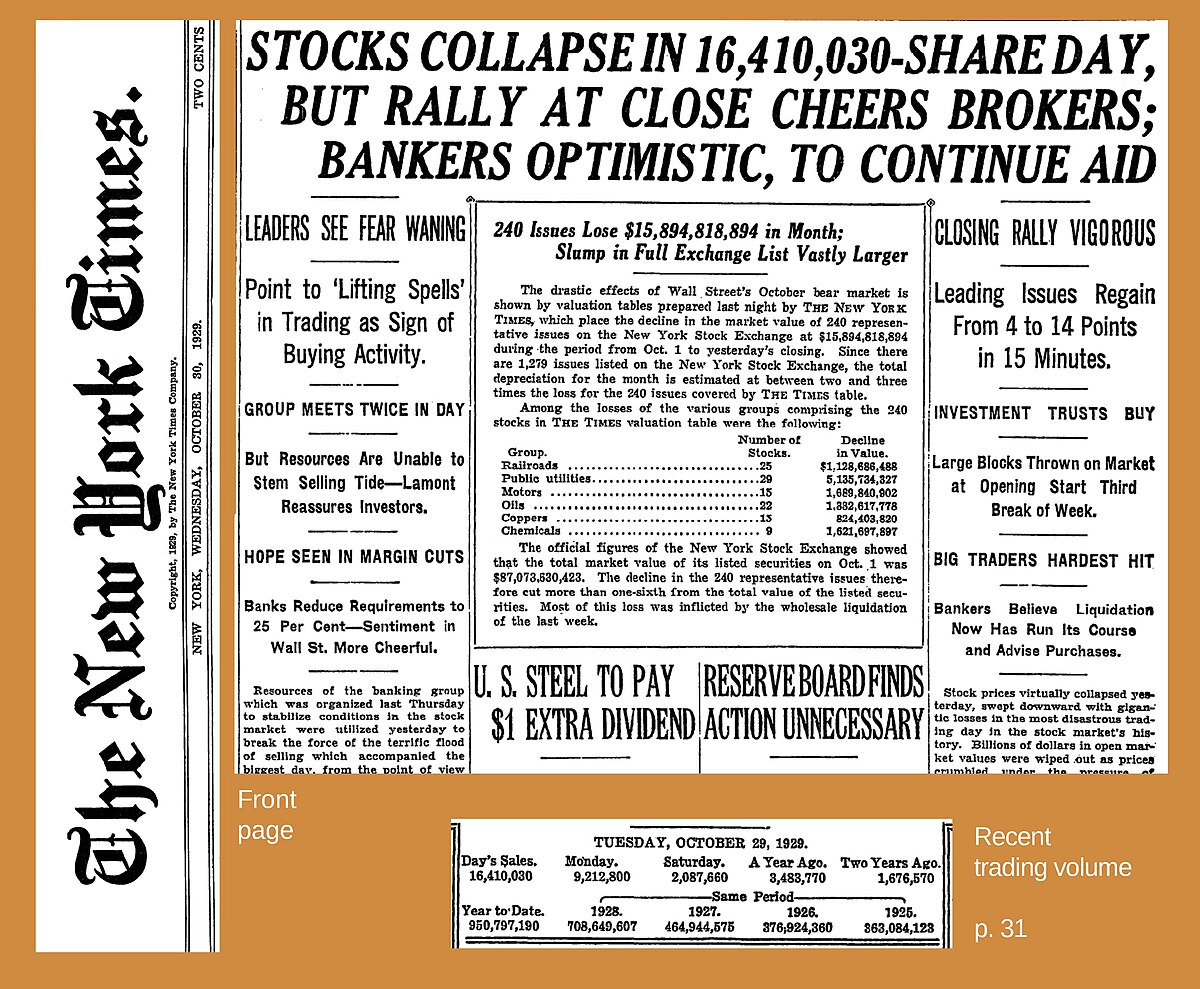
The New York Times front page on October 30, 1929, reports on the historic panic selling and record trading volume during Black Tuesday. Work for hire of The New York Times, Public domain, via Wikimedia Commons
Panic erupted in late October 1929 across Black Thursday, Black Monday, and Black Tuesday. On Black Monday alone, the Dow fell 12.8%, clogging ticker tape machines and telegraph lines with sell orders. The index dropped 23% in two days and eventually lost 89% of its value by July 1932. It took 25 years for the Dow to return to its September 1929 peak.
Black Monday in 1987
On October 19, 1987, the Dow Jones Industrial Average plummeted 508 points in a single session, losing 22.6% of its value. This single-day collapse followed five years of rapid global growth, during which the 19 largest stock markets in the world gained an average of 296%.
The Dow Jones Industrial Average chart reveals the sudden, steep collapse of stock prices on Black Monday in October 1987. Autopilot, CC BY-SA 3.0, via Wikimedia Commons
The sheer volume of sell orders overwhelmed financial infrastructure. The New York Stock Exchange suffered 195 trading halts and delays across its listed stocks, while the NASDAQ market system failed completely. Unlike the 1929 collapse, however, the 1987 crash did not lead to a long-term bear market.
Test yourself
In a stock market crash, what can drive prices down further?
Falling prices prompt selling, which pushes prices lower.. Selling to limit losses adds downward pressure, which can frighten more investors into selling and reinforce the drop.
During a stock market crash, many investors sell as prices fall. What can happen next?
Their sales deepen the drop and prompt more selling.. A crash can feed on itself: selling pushes prices lower, and the deeper fall can lead more investors to sell.
In a stock market crash, what can drive prices down further?
Falling prices prompt selling, which pushes prices lower.. Selling to limit losses adds downward pressure, which can frighten more investors into selling and reinforce the drop.
Play the lesson in edgi and the card is yours. It lands on your Map next to the ideas it connects to, and turns from matte to foil to gold as you learn more around it.
What is the numerical definition of a stock market crash?
There is no official numerical definition of a crash. In practice, the term commonly describes a market index decline of more than 10% over the course of several days.
How does a stock market crash differ from a bear market?
A bear market is a prolonged period of declining stock prices measured in months or years. A crash is a sudden, abrupt plunge driven by panic selling that takes place over a matter of days. A crash can happen without turning into a bear market, just as a multi-year bear market can unfold without a single crash.
What was the earliest recorded economic bubble?
Tulip Mania in the Netherlands from 1634 to 1637 is widely considered the first recorded economic bubble. During the peak of speculation, single tulip bulbs allegedly sold for over 10 times the annual income of a skilled artisan before prices collapsed.